
Geometry comes before analytics
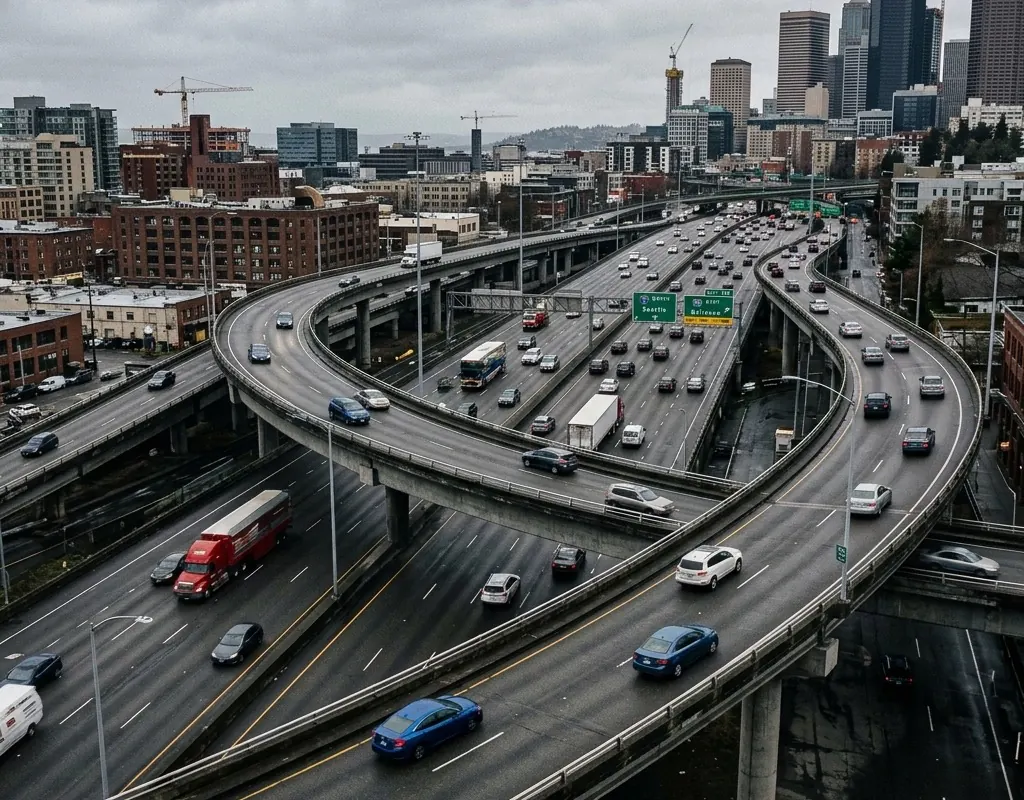
Curves, grades, lane changes, queues, large vehicles and roadside objects affect line of sight. Draw detection and evidence zones on the actual road geometry. Confirm mounting height, angle, maintenance access and the location of power and network equipment.
The target is not simply “coverage.” It is reliable measurement of the events the operator needs without ambiguous lane assignment or avoidable occlusion. The radar-video transportation sensor guide provides reference configurations for flow, access, speed and collision-warning applications.
| Design layer | Decision to freeze | Acceptance check |
|---|---|---|
| Road geometry | Lanes, curves, grades and occlusion zones | Representative tracks mapped to correct lanes |
| Event model | Counts, classes, speed, alerts and evidence | Platform receives complete, non-duplicated events |
| Time | Authoritative source and timestamp format | Sensor, video and platform records correlate |
| Governance | Retention, access and disclosure rules | Roles and audit logs match the approved policy |
| Operations | Health, outage and maintenance workflow | Operators detect loss and recover the service |
Define the data contract
List the required counts, classes, speeds, tracks, images, video clips, alarms and health signals. Define timestamps, identifiers, coordinate conventions, retry behavior and how duplicate events are handled.
Time synchronization deserves explicit design. A correct event with an inconsistent timestamp can break correlation, enforcement evidence and incident reconstruction.
Privacy and cybersecurity are architecture inputs
Decide whether identifiable imagery is required, who may access it and how long it is retained. Use role-based access, strong authentication, network segmentation, encrypted management paths and audit logs appropriate to the deployment.
Remote maintenance should not create an undocumented path around the operator’s security controls. Account ownership, update process and credential recovery belong in the acceptance pack. These choices connect directly to the smart city transportation architecture and, at controlled facilities, the critical infrastructure protection workflow.
Acceptance should resemble the road
Test representative vehicle mix, density, speeds, day and night conditions, glare and expected weather. Compare speed against a traceable reference and inspect lane assignment, classification and event latency.
Finish by testing device health, network loss, recovery and platform integration. The installation is complete only when operators can trust both the measurement and the workflow around it. Supporting checklists and documentation pathways are available in the OMNI UXV knowledge hub.
Survey each lane as a measurement problem
Create a lane and movement inventory before choosing mounting points. Include through lanes, turn pockets, shoulders, ramps, bicycle or pedestrian areas where relevant, queue spillback and the places where vehicles merge or change lane. For each movement, identify the measurement required and the likely occlusion or multipath source.
The survey should record proposed sensor coordinates, height, orientation, field of view, radar boresight, cable path, cabinet, power, network and safe maintenance access. Verify that a technician can service the installation without creating an unacceptable road hazard. Where one location cannot see all required movements reliably, the architecture should acknowledge the gap or use another view.
| Survey output | Why it matters at acceptance |
|---|---|
| Lane and movement map | Provides the reference for assignment and count checks |
| Occlusion assessment | Identifies where vehicle type and traffic density may reduce performance |
| Evidence zones | Defines where images or clips should be captured |
| Communications path | Supports latency, outage and recovery tests |
| Maintenance plan | Confirms the system can be kept aligned and available |
Test the data path in layers
First validate the sensor locally against a traceable reference. Then verify the connector or protocol, followed by the receiving platform and operator workflow. This sequence makes it possible to locate an error. A correct local track that appears in the wrong lane on the platform may indicate mapping or coordinate transformation rather than sensor performance.
Use stable event identifiers and define how retries, delayed messages and duplicates are handled. Verify behavior across a restart or temporary network loss. For video evidence, confirm the relationship among trigger time, pre-event buffer, clip identifier and the traffic event.
Operate a measurement service after handover
Post-installation monitoring should expose device health, alignment change, clock drift, storage, network quality and data-volume anomalies. A sudden fall in counts might reflect traffic conditions, but it may also indicate a blocked view or failed connector. Define who investigates and how the period of uncertain data is marked.
Periodic checks should use representative samples by lane, time and vehicle class rather than a single aggregate accuracy figure. Preserve configuration changes and calibration results so data users know when a trend may have been affected by the sensing system. The long-term deliverable is trusted traffic data with a known operating history, not merely an installed pole.